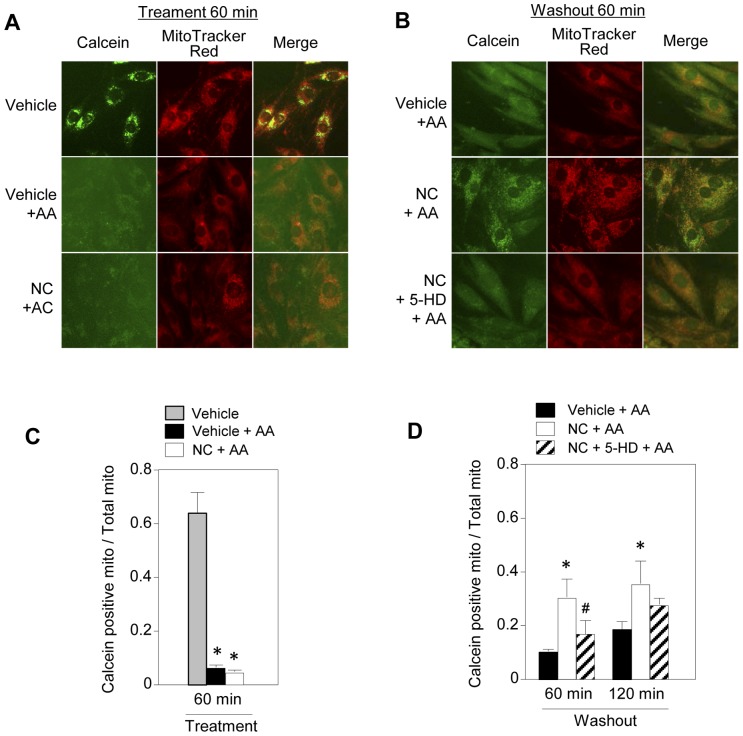
Figure 2. Effects of mKATP channel openers on antimycin A-induced mPTP opening and its recovery in H9c2 cells.
A and B: Calcein and MitoTracker images before (A) and after (B) antimycin A (AA) treatment. C and D: Levels of calcein-positive mitochondria 60 min after AA treatment (C) and 60 and 120 min after washout of AA (D). Level of calcein-positive mitochondria is expressed as the ratio of calcein-positive area to MitoTracker-positive area. *p<0.05 vs. Vehicle+AA, #p<0.05 vs. NC+AA.

