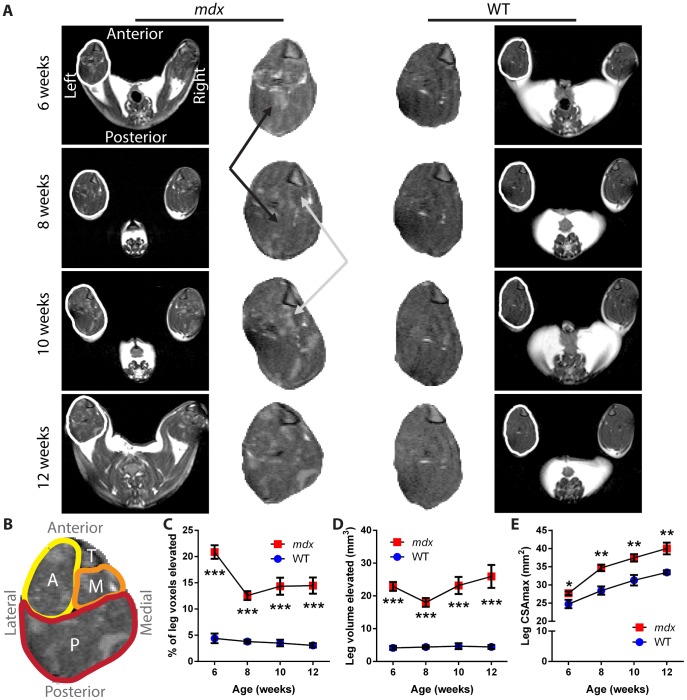
Figure 2. T2 of mdx leg shows changes in dystrophic muscle and cross-sectional area over time.
A) Representative T2-weighted images from one mdx mouse (left) and one wild-type mouse (right) over time, each imaged from 6 to 12 weeks of age. The full MRI image of each mouse is provided on the outside column, with the leg of the left hindlimb for each mouse outlined in white and a magnified version of the leg muscles provided in the center columns. The black arrows mark a region of mdx muscle that showed a reduction in intensity between time points, while the gray arrows mark a region that showed an elevation of intensity between time points. The tibia, visible as a triangular structure in the upper right corner of each leg section, was used to orient the muscle slices. B) Orientation and anatomy of the leg cross sections. Anterior muscle groups (A, yellow) include tibialis anterior and extensor digitorum longus. Medial muscle groups (M, orange) include flexor hallucis and flexor digitorum. Posterior muscle groups (P, red) include gastrocnemius, soleus, and plantaris. The tibia bone is also marked (T). C) The percentage of tissue within the leg muscle that showed signal intensity elevated over the threshold that separates healthy muscle from affected tissue illustrates a change between the necrotic (6 week) and recovery phases of mdx disease. D) The absolute volume of tissue with elevated signal intensity detected within the leg of mice. E) The CSAmax values over time show the growth of muscle, and an increase for the mdx mice as compared to wild-type mice (n = 5 wild-type and 6 mdx mice; data are means ±SEM; *p<0.05, **p<0.01, ***p<0.001).

