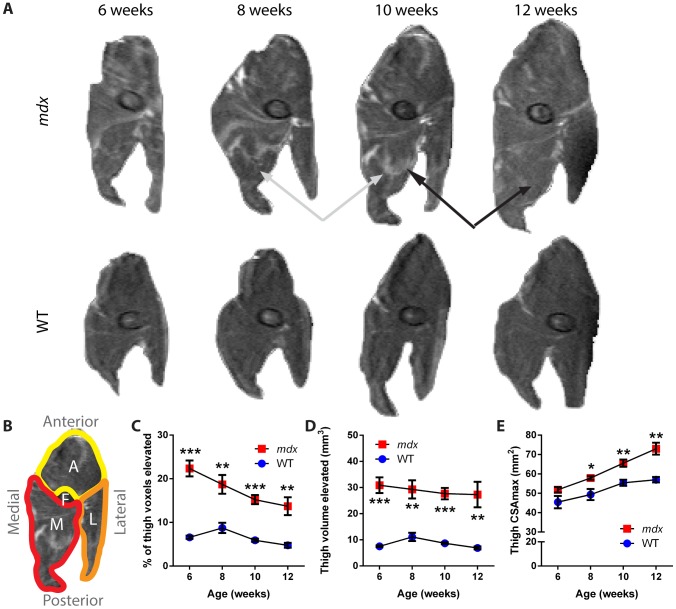
Figure 4. Changes in T2 imaging and cross-sectional area of dystrophic mdx thighs over time.
A) Representative T2-weighted images of thigh muscle from the right hindlimb of one mdx and one wild-type mouse over the study period. The black arrows mark a region of muscle that showed a reduction in intensity over time, while the gray arrows mark a region that showed an increased intensity over time. The femur is visible as an elliptical structure towards the center of the thigh. B) Orientation and anatomy of thigh cross sections. Anterior muscle groups (A, yellow) include vastus intermedius, vastus lateralis, and rectus femoris. Lateral muscle groups (L, orange) include biceps, semitendinosus and semimembranosus muscles. Medial muscle groups (M, red) include gracilis and adductor muscles. The femur bone (F) is also marked. C) The percentage of tissue within the thigh muscle that showed a signal intensity elevated over the threshold that separates healthy muscle from affected tissue shows a difference between mdx and wild-type mice at all time points. D) The absolute volume of tissue with an elevated signal within the thigh of mdx and wild-type mice. E) CSAmax shows growth of the muscle size over time, and an increase in the cross-sectional area of the thigh muscle in mdx mice as compared to wild-type mice from 8 weeks onward (n = 5 wild-type and 6 mdx mice; data are means ±SEM; *p<0.05, **p<0.01, ***p<0.001).

