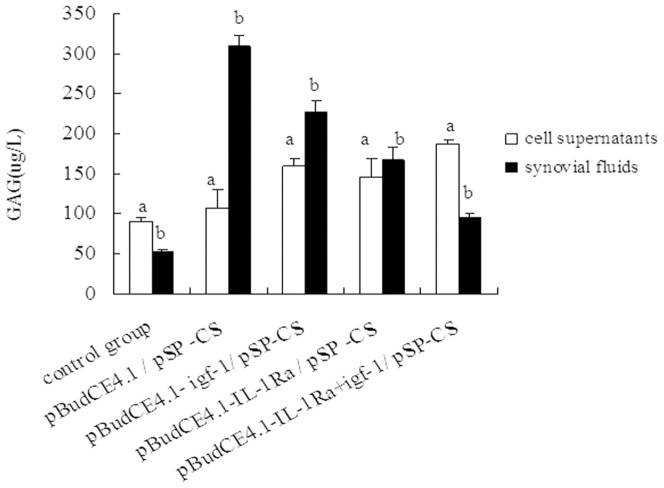
Figure 4. Concentration of GAG in cell supernatant and synovial fluid.
The concentration of GAG in cell supernatant and synovial fluid was measured by ELISA. The data are shown as the mean ±S.D. a shows GAG contents in cell supernatant of each group compared with p<0.05; b shows GAG in synovial fluid from the rabbit knees of each group compared with p<0.05.

