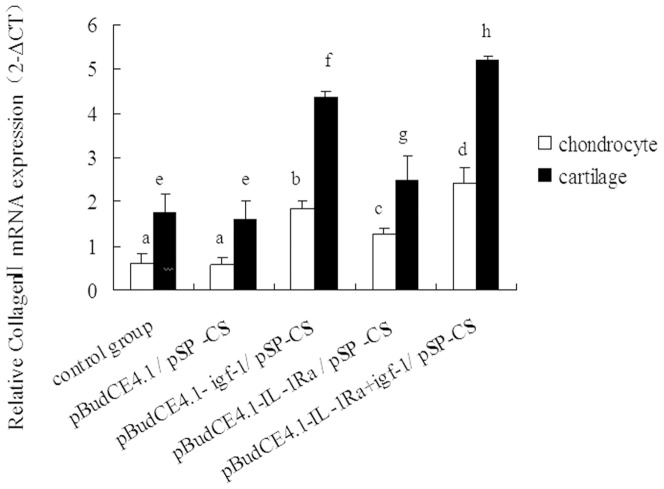
Figure 7. The relative expression of collagen II mRNA in different groups was determined by RT-qPCR.
The data are shown as the mean ±S.D. The raw collagen II mRNA expression data for each group were calibrated to the B2M reference gene, and the relative expression level of collagen II was represented as 2−△CT. a, b, c and d show the relative expression of collagen II mRNA in each cultured chondrocyte group compared with p<0.05; e, f, g and h show the relative expression of collagen II mRNA in cartilage tissue from rabbit knees compared with p<0.05.

