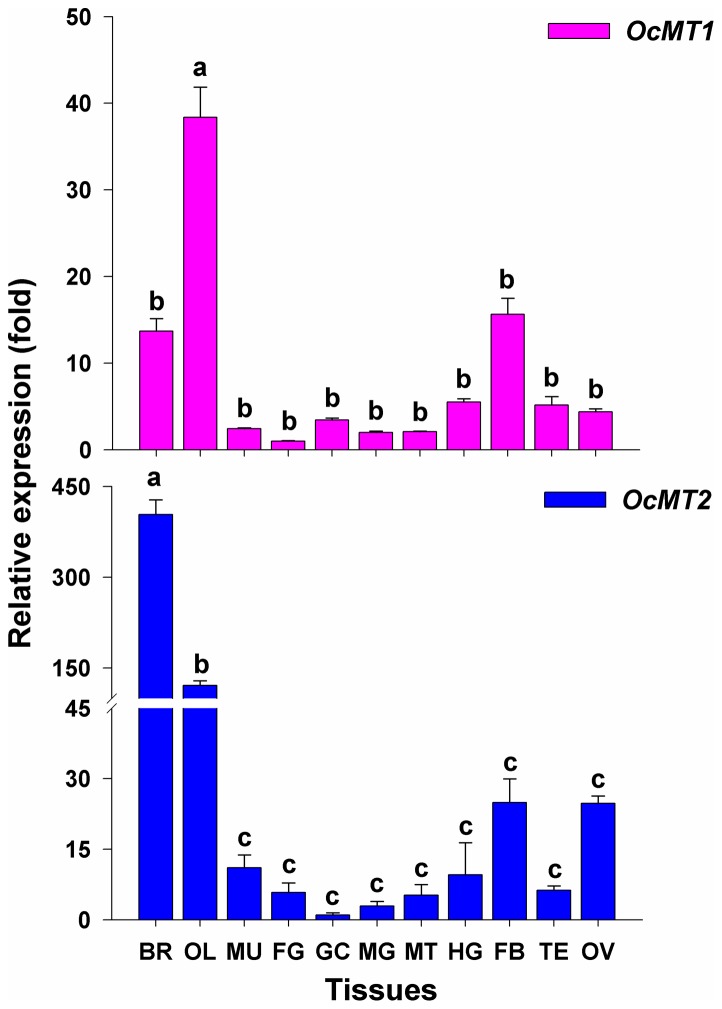
Figure 3. Tissue-specific transcript expressions of OcMT1 and OcMT2 in adults on day 3.
The β-actin gene was used as an internal control. The tissues include the brain (BR), optic lobe (OL), muscle (MU), foregut (FG), midgut (MG), hindgut (HG), gastric caeca (GC), Malpighian tubule (MT), fat body (FB), testis (TE) and ovary (OV). The different letters on the error bars indicate significant differences in the expression of the same gene in different tissues. The data are expressed as the means ± SE of three biological replicates. The relative expressions of OcMT1 and OcMT2 were calculated using 2−ΔΔCt. The vertical bars represent the mean ± SE. (P<0.05, Tukey's HSD test; n = 3).

