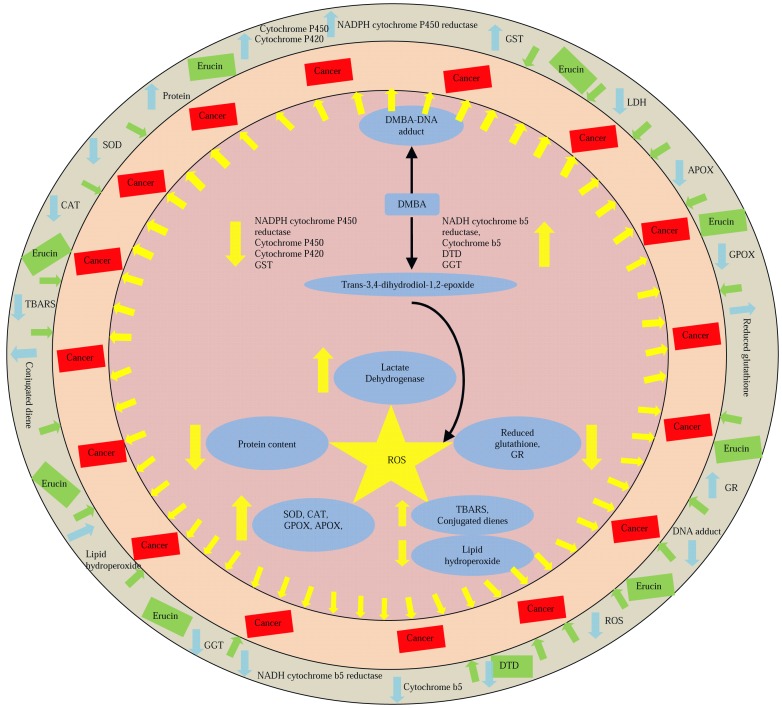
Figure 7. Depicts the graphical representation of modulation of different parameters in response to the interaction of DMBA (7, 12-dimethylbenz(a)anthracene) and erucin in the in vivo system.
↑ -Shows increase in the activity: ↓ -Shows decrease in the activity. Yellow arrow represents general effect of reactive oxygen species. Blue arrows represents effect of DMBA and green arrows represents the effect of erucin.

