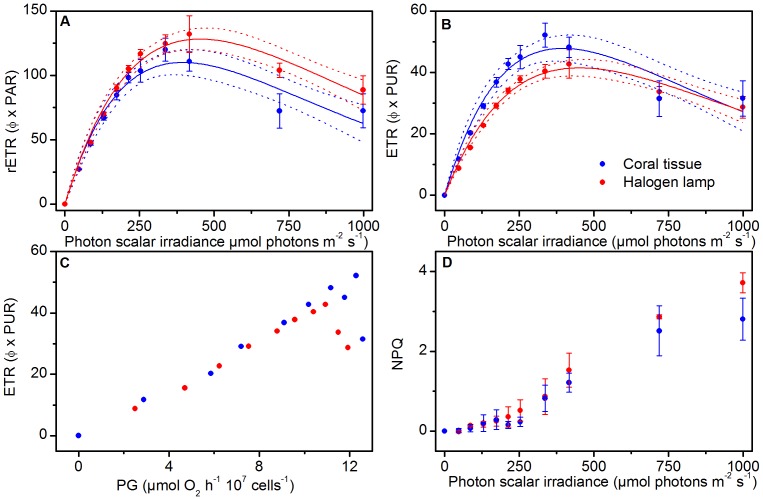
Figure 4. Effect of spectral light composition on (A) rETR vs. PAR and (B) ETR vs. PAR.
(C) Relationship between gross photosynthesis (PG) and ETR. (D) Non-photochemical quenching (NPQ). Note that the y-axis scale in (A) and (B) differ. Solid lines indicate best fits and dotted lines represent 95% confidence intervals (r2>0.91). Symbols and error bars represent the mean ± SE (n = 3).

