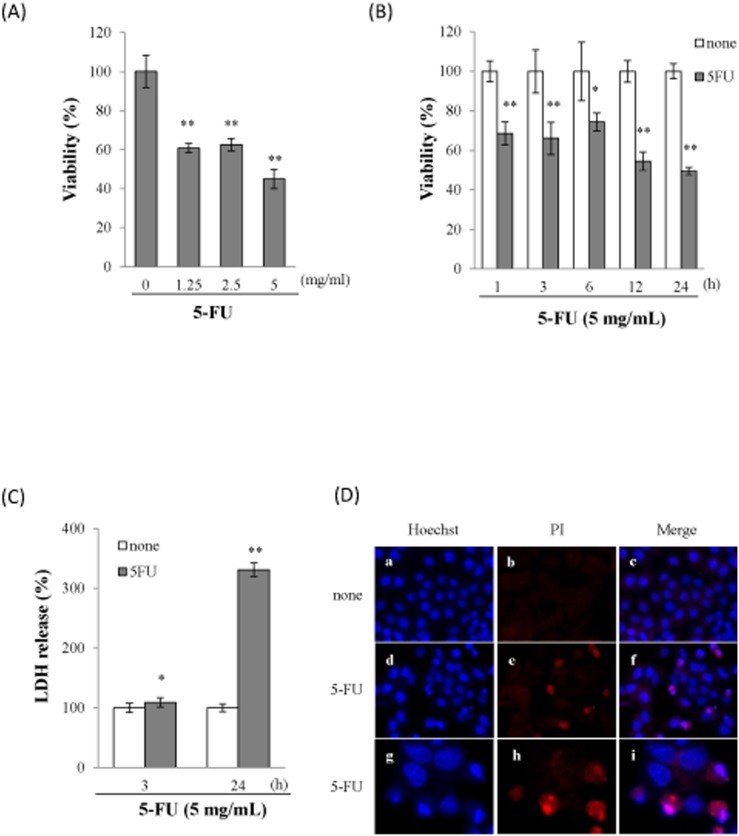
Figure 1. 5-FU induced Sa3 cell death.
(A), Viability of Sa3 cells incubated with various concentrations of 5-FU for 24 h. Values are means ± S.E.M. (n = 8). **p<0.01 compared to untreated cells. (B), Time course of cell viability of Sa3 cells incubated with 5 mg/mL of 5-FU. Values are means ± S.E.M. (n = 8). *p<0.05, **p<0.01 compared to control cells. (C), LDH levels in culture media after 3-h and 24-h incubations with 5-FU. Data shown are percentages with respect to control cells at each time point. Values are means ± S.E.M. (n = 8). *p<0.05, **p<0.01 compared to Sa3 cells incubated without 5-FU. (D), Micrographs of Sa3 cells incubated without (a–c) or with (d–i) 5-FU for 24h. Hoechst 33342- (a, d, g) and PI-stained cells (b, e, h) and merged images (c, f, i) are shown. Micrographs of cells incubated with 5-FU for 24 h at high magnification (×1,000) (g–i).

