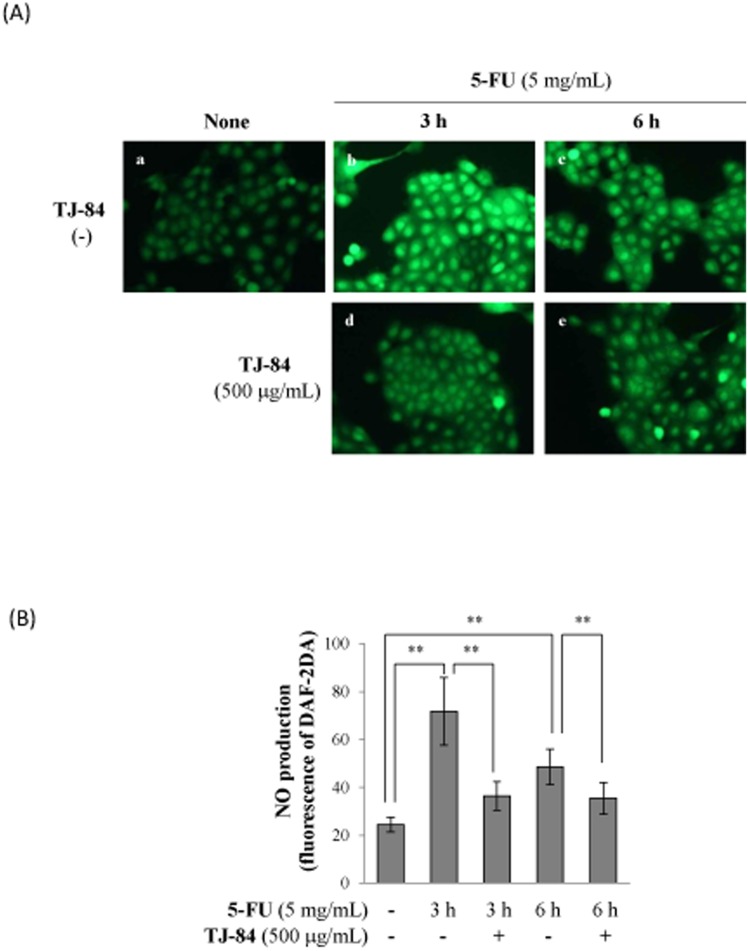
Figure 8. TJ-84 attenuated 5-FU-induced NO production.
(A), Sa3 cells were incubated with or without 5 mg/mL of 5-FU for 3 h following a 1-h pre-incubation with 500 µg/mL of TJ-84. DAF-2DA was then loaded for 30 min. The production of NO (green) were detected by fluorescence microscopy. (B), The fluorescence intensity per cell was calculated using ImageJ. The calculation of the red/green ratio is shown on the graph. Values are means ± S.E.M. (n = 50). **p<0.01 compared to the control cells.

