
Figure 3. Net photosynthetic rate (Pn) and stomatal conductance (gs) of two cotton cultivars as affected by different NaCl concentrations.
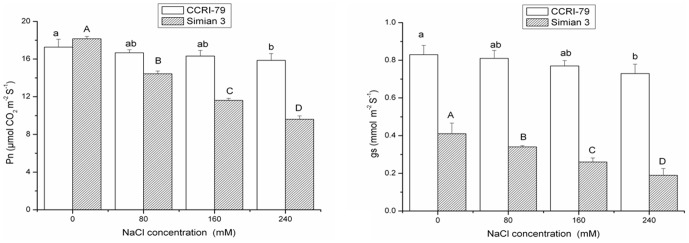
Vertical bars represent ± standard error (n = 3). Bars labeled with the different lowercase letters on open square bars or uppercase letters on closed square bars are significant difference (P<0.05).