
Figure 6. Effect of NaCl salinity on the concentrations of H2O2 in the roots and leaves of cotton.
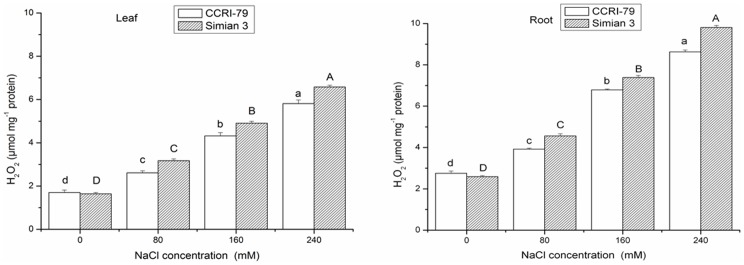
Vertical bars represent ± standard error (n = 3). Bars labeled with the different lowercase letters on open square bars or uppercase letters on closed square bars are significant difference (P<0.05).