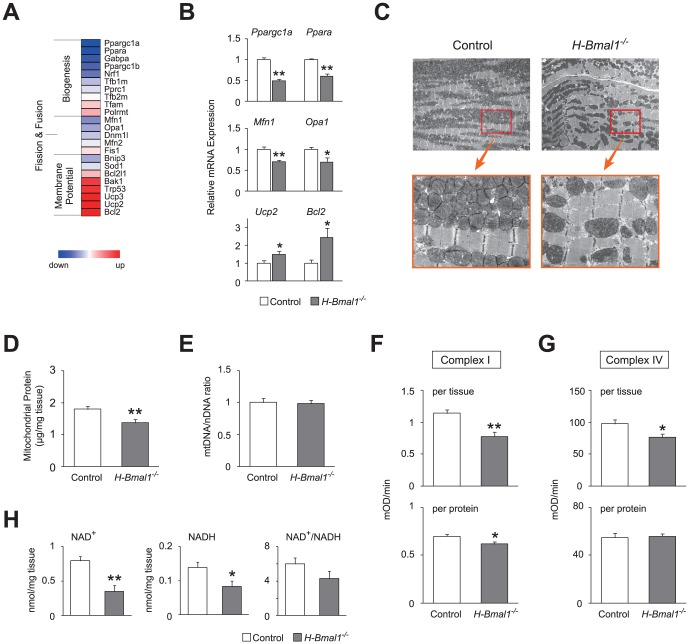
Figure 3. Mitochondrial abnormalities in the hearts of 12-week-old H-Bmal1 −/− mice.
(A) A heat-map representing the expression profiles of genes regulating mitochondrial structure and function in Bmal1 −/− hearts. (B) Relative expression levels of genes associated with mitochondrial biogenesis, dynamics, and membrane potential in the heart tissue of control and H-Bmal1 −/− animals (n = 6 per group). (C) Representative electron micrographs of sections taken from the left ventricular muscle from control and H-Bmal1 −/− mice at two different magnifications. (D) Mitochondrial protein concentration in control and Bmal1 −/− hearts (n = 8 per group). (E) Mitochondrial DNA to nuclear DNA ratio in control and Bmal1 −/− hearts (n = 6 per group). (F-G) Enzymatic activities of (F) complex I and (G) complex IV in control and Bmal1 −/− hearts (n = 8 per group). The activities of the mitochondrial respiratory enzymes are expressed either per milligram of tissue used for mitochondrial isolation (top panels) or per microgram of mitochondrial protein (bottom panels). (H) NAD+ and NADH concentrations in control and Bmal1 −/− hearts (n = 6 per group). Data are the mean ± SEM. *P<0.05, **P<0.01, unpaired two-tailed Student's t-test.

