
Figure 5.
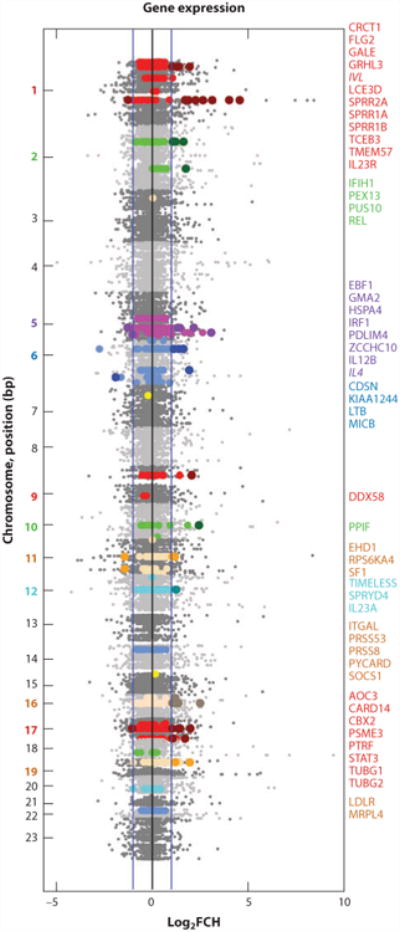
SNPs and gene expression in psoriasis lesions. Manhattan-type plot depicting (in gray shades) the magnitude of dysregulation of the HGU133 Plus 2.0 genes on the MAD3 psoriasis transcriptome by their base pair (bp) position on the genome (110). Blue lines on the x-axis represent a twofold change in the log2 scale. In a recent meta-GWAS, 36 SNPs were identified as psoriasis susceptibility loci (21 known loci, 15 new loci) (102). Genes that are located +/− 500 kb around each SNP are highlighted in colors (by chromosome). Dots in darker shades are for those genes differentially regulated in the MAD3 transcriptome, with the corresponding gene name listed on right, colored by chromosome.