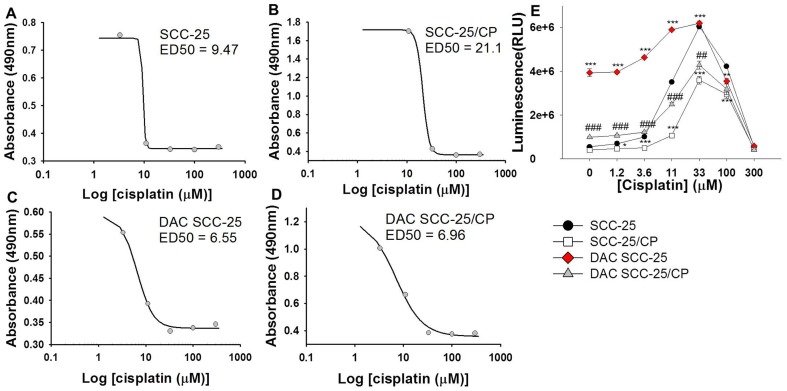
Figure 1. Decitabine pre-treatment enhances cytotoxic and apoptotic activity of cisplatin.
(A-D) Cell viability is represented by absorbance (y-axis) and compared to common log of cisplatin concentration (µM). ED50, the concentration needed to inhibit viability by 50%, is listed for each cell line. (E) The graph depicts apoptosis activity (caspase 3/7 activity, measured as luminescence on y-axis) at different cisplatin concentrations (3-300 µM). A decrease in apoptotic activity at high dose ranges is an expected phenomenon in this assay due to early cell death from high drug doses prior to quantification. Decitabine pre-treatment in cisplatin-resistant SCC-25/CP cells increases apoptotic activity of cisplatin relative to non-treated SCC-25/CP cells. Decitabine pre-treatment in cisplatin-sensitive SCC-25 cells also increases apoptotic activity of cisplatin at lower doses. One Way ANOVA, Holm-Sidak test pairwise comparisons, *p<.05, **p<.01, ***p<.001, compared to SCC-25; #p<.05, ##p<.01, ###p<.001, compared to SCC-25/CP.

