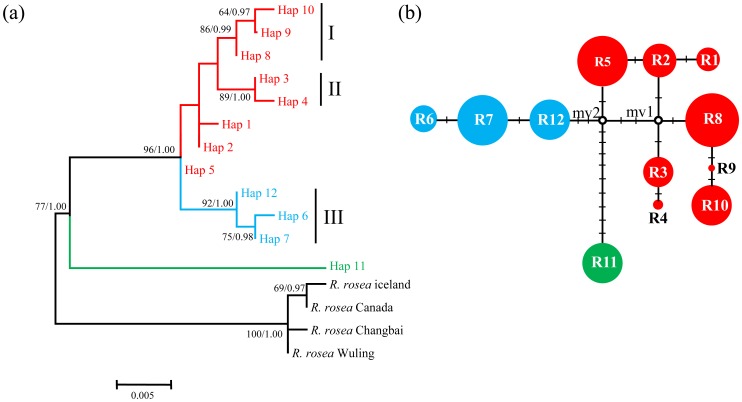
Figure 3. Phylogenetic relationships obtained by analysis of ITS ribotypes.
(a) Bayesian tree with numbers above the branches indicating bootstrap values greater than 50% for MP analysis and Bayesian posterior probabilities. (b) NETWORK-derived genealogical relationship. The sizes of the circles in the network are proportional to the observed frequencies of the ribotypes. The small black bars represent mutation steps and the red dots represent missing ribotypes. For both subfigures, different colors represent different geographic origins of ribotypes: red, the Qinghai-Tibetan Plateau and Hengduan Mountains; blue, northern China; green, central Asia.

