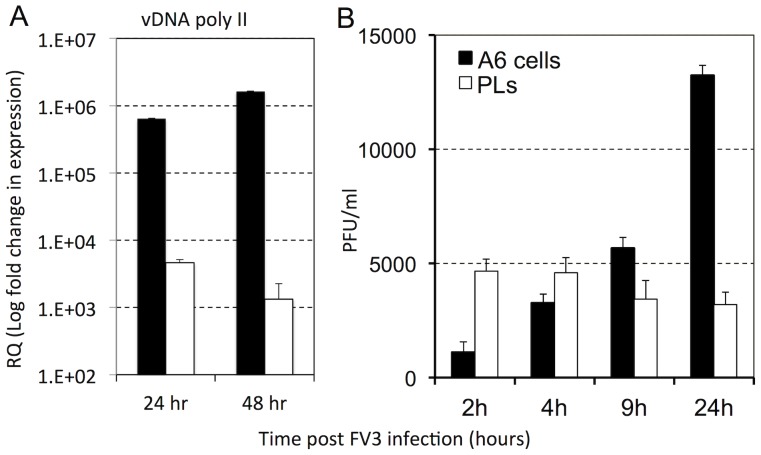
Figure 7. Comparison of viral gene expression and infectious virus produced by PLS and A6 kidney cell line infected in vitro with FV3.
PLs from uninfected outbred animals and Xenopus A6 kidney cells were seeded at 1×10⁶ cells/well and infected with a MOI of 1 for (A) 24 and 48 hrs or (B) 2, 4, 9, 24 hrs. (A) The PLs and A6 cultures infected for 24 and 48 hrs were assessed for FV3 vDNA Pol II gene expression by the delta∧deltaCT method qRT-PCR, using GAPDH as an endogenous control. (B) The FV3 infectious burdens were enumerated by performing plaque assays on FV3-infected PLs and A6 culture lysates. Results are means ± SEM, N = 3.

