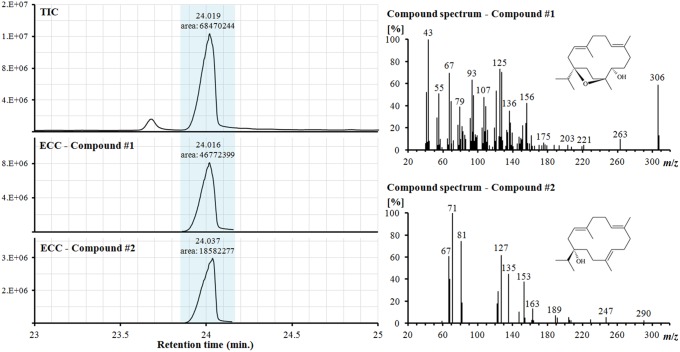
Figure 3. Mass spectral deconvolution of incensol and serratol in an underivatized extract of Boswellia carterii.
Abbreviations: TIC = total ion count chromatogram, ECC = extracted compound chromatogram, m/z = mass to charge ratio. Deconvoluted mass spectra are identified as (#1) incensol and (#2) serratol (see text).

