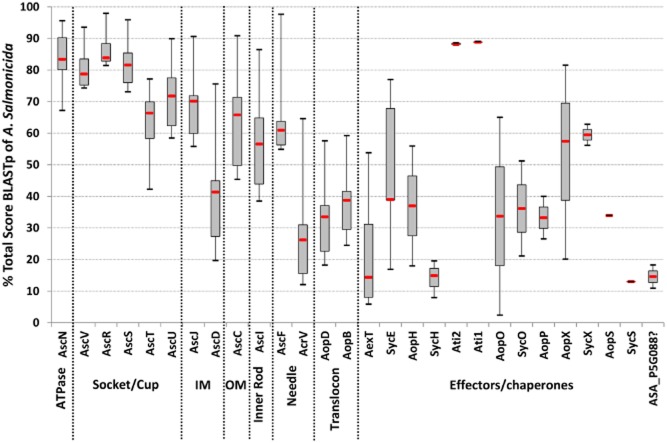
Figure 2.
T3SS homology in the Ysc family.
The diagram shows the conservation variability of T3SS structural components of Photorhabdus luminescens, Yersinia pestis, Vibrio parahaemolyticus, Pseudomonas aeruginosa and Photobacterium damselae in comparison to A. salmonicida subsp. salmonicida. For each cited T3SS component, the variability (BLASTp total score) of orthologues is represented in percentage of the A. salmonicida BLASTp total score. The homology decreases from the inner to the outer parts of the T3SS and is the lower for the translocon.

