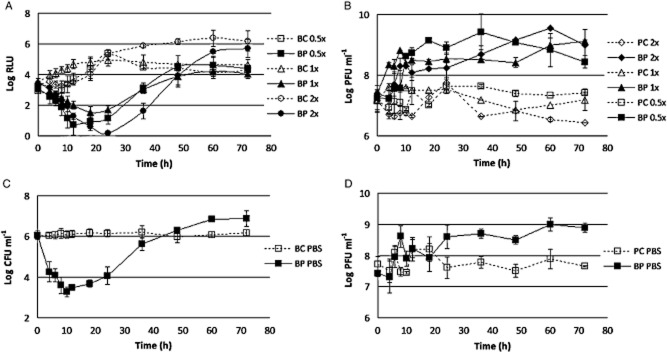
Figure 6.

Inactivation of bioluminescent E. coli by the phage at different organic matter concentrations. (A), bacterial bioluminescence in TSB, (B) phage concentration variation in TSB, (C) variation of bacterial concentration in PBS and (D) variation of phage concentration in PBS, throughout the 72 h experiment. Values represent the mean of three independent experiments; error bars indicate the standard deviation. BC, bacteria control; BP, bacteria plus phage; PC, phage control.
