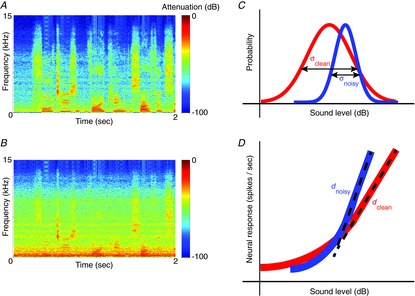
Figure 1. Adaptation to stimulus contrast.

A, spectrogram of a sample of human speech (a ‘clean’ sound), showing how the frequency content of the speech changes over time. B, spectrogram of the same speech sample, with noise added (a ‘noisy’ sound). C, idealized sound-level distributions of the clean (red) and noisy (blue) sound, showing that the noise reduces the standard deviation, σ, of the signal. D, idealized responses of a neuron with contrast gain control. The neuron adjusts its gain, d, according to the standard deviation of the signal, so that, for both clean and noisy sounds, the dynamic range of the neuron matches the range of stimulus levels encountered.
