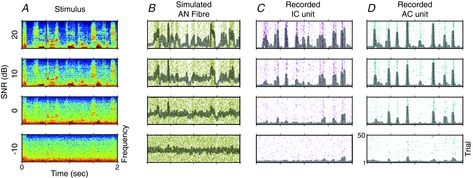
Figure 2. Noise-invariant neural responses.

A, spectrograms of a clean sound (a sample of speech, top), embedded in increasing levels of noise (other rows). B, simulated responses of an auditory nerve (AN) fibre to these sounds. The fibre shows clear responses to the clean sound (top), but these are rapidly degraded as more noise is added (other rows). C and D, recorded responses of neurons in ferret inferior colliculus (IC) and auditory cortex (AC) to the same sounds. In IC (C) and especially in AC (D), the lower rows more closely resemble the top row, indicating that neuronal responses in the central auditory pathway are more robust to the addition of noise (i.e. they are more noise invariant). Based on Rabinowitz et al. (2013).
