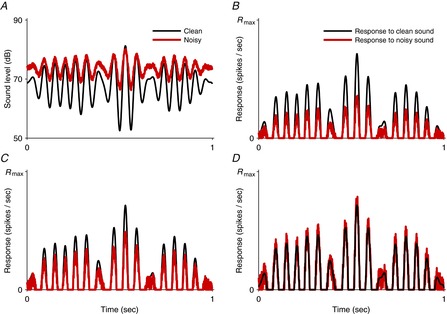
Figure 3. Gain control and normalization.

A, the waveform of a clean sound (black line) and the same sound after noise has been added (red line). The effect of the noise is both to increase the mean sound level and to reduce the sound contrast (variance of sound level). B–D, idealized neuronal responses to the clean sound (black) and noisy sound (red). B shows a neuron that adapts its dynamic range to compensate for changes in mean sound level. Due to this adaptation, the neuron does not produce an ongoing response to either the clean or the noisy sound; instead, it responds to deviations of the sound from the mean level. As the neuron does not adapt to compensate for stimulus contrast, the relative strength of the responses depends on whether the sound is clean or noisy. C shows a neuron which also adapts to compensate partly for changes in stimulus contrast. The gain of the neuron is higher for the noisy sound than for the clean sound, and so the strengths of responses to the clean and noisy sounds are more similar than in B. Contrast gain control of this kind is frequently seen in ferret primary auditory cortex. D shows a neuron which completely compensates for changes in both mean sound level and sound contrast. The responses are now very similar, differing only in the fine structure introduced by the noise. Complete compensation of this kind (contrast normalization) has not yet been observed in the auditory system. Rmax, maximal firing rate.
