
Figure 13. Activation of NK1 receptors results in SOCE in dorsal horn neurons.
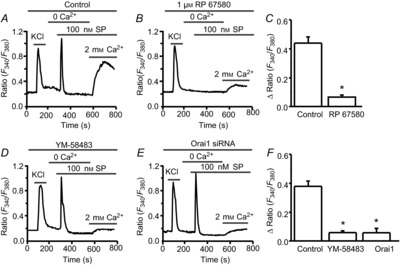
A and B, representative examples of substance P (SP)-induced Ca2+ responses in the absence (A), or in the presence of 1 μm RP 67580 (B). C, summary of the effect of RP 67580 on SP-induced SOCE. D and E, representative examples of SP-induced Ca2+ responses in the presence of YM-58483 (D), or after knockdown of Orai1 (E). F, summary of the effects of 3 μm YM-58483 and knockdown of Orai1 on SP-induced SOCE. Values represent mean ± SEM; n = 42–54 neurons each; *P < 0.05, compared with control by Student's t test (C) or one-way ANOVA (F).