
Figure 3. Active and passive properties of PV-Rosa and Som-Rosa interneurons.
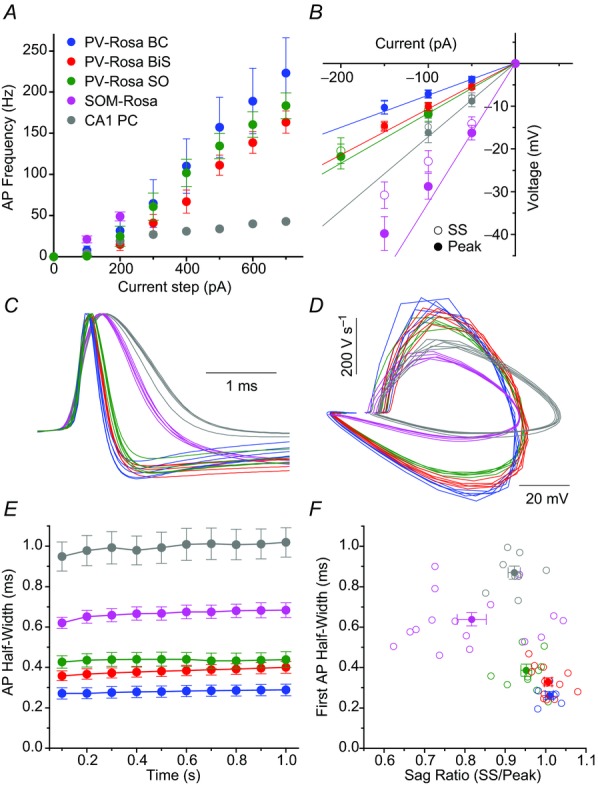
A and B, average AP frequency vs. +100–700 pA depolarizing current steps and (B) current–voltage relationship for (blue) PV-Rosa BCs (n = 6), (red) PV-Rosa BiSs (n = 13), (green) PV-Rosa SO interneurons (n = 11), (magenta) SOM-Rosa interneurons (n = 12) and (grey) a CA1 PC for reference. B, open symbols denote SS voltage responses; closed symbols denote peak responses. Continuous lines denote slopes through 0 pA and –50 pA or –100 pA points for peak voltage responses, illustrating a higher sag ratio in PV-Rosa than SOM-Rosa interneurons. C, AP waveforms of the first five APs from a representative cell from the respective cell types, showing that PV-Rosa interneuron subtypes exhibit a narrower AP half-width than in the SOM-Rosa interneuron or CA1 PC. D, phase plots of dV/dt vs. voltage for the respective cell types illustrating a larger dV/dt in PV-Rosa interneurons than the SOM-Rosa SO interneuron or CA1 PC. E, population data of AP half-width over the course of a 1 s long, +300–700 pA current step from −60 mV for (blue) PV-Rosa BCs (n = 6), (red) PV-Rosa BiSs (n = 13), (green) PV-Rosa SOs (n = 11), (magenta) Som-Rosa interneurons (n = 12) and (grey) CA1 PC (n = 5). F, scatter plot showing that PV-Rosa interneuron subtypes have a narrower AP half-width and higher sag ratio than SOM Rosa interneurons or CA1 PCs. AP, action potential; BC, basket cell; BiS, bistratified cell; PC, pyramidal cell; SO, stratum oriens; SS, steady state.