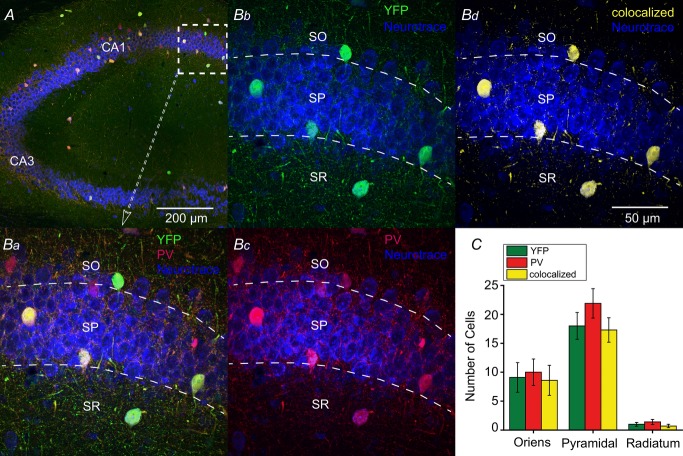
Figure 4. CRE expression in the hippocampus of PV-CRE mice is specific to PV-positive neurons.
A, specificity of CRE expression to PV interneurons was confirmed with anti-PV antibody (red) in PV-Rosa mice; YFP+ neurons intensified with an anti-GFP antibody and slices were counterstained with Neurotrace 435/455 (blue). Ba, expanded region in (A) (dotted box). YFP+ expressing neurons (Bb) and PV neurons (Bb) in CA1 were overlaid to generate a colocalized channel (Bd). C, number of YFP+, PV and colocalized neurons were graphed by laminar location. From ten 50 μm thick hippocampal slices (n = 3 mice), 18 ± 2.3 EYFP+ cells were located in SP compared to SO (9.1 ± 2.6; Mann–Whitney test, U18 = 18, P = 0.0136, n = 10) or SR (1.0 ± 0.33; Mann–Whitney test, U18 = 0, P < 0.0001, n = 10). Similarly, the majority of PV cells were located in SP (21.9 ± 2.5) compared to SO (10.0 ± 2.3; Mann–Whitney test, U18 = 15, P = 0.0063, n = 10) or SR (1.4 ± 0.45; Mann–Whitney test, U18 = 0, P < 0.0001, n = 10). Of 333 cells, no statistically significant differences were observed in the number of EYFP+, PV and colocalized signals across SO, SP and SR layers (P > 0.05). PV, parvalbumin; SO, stratum oriens; SP, stratum pyramidale; SR, stratum radiatum.

