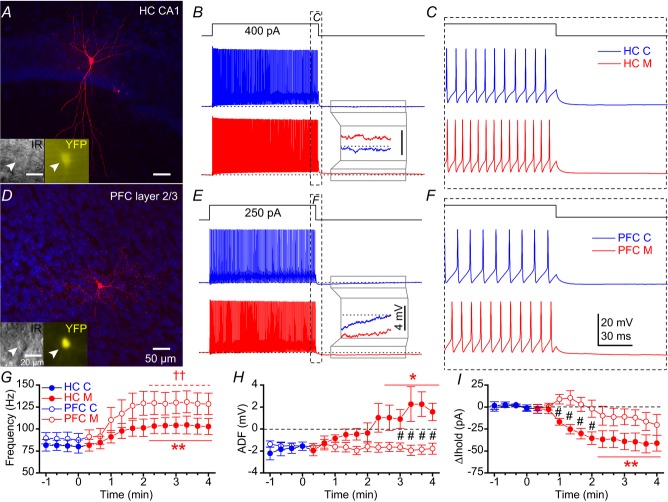
Figure 5. mAChR activation enhances PV-Rosa interneuron excitability in both CA1 HC and PFC.
A, biocytin image of a PV-Rosa interneuron in the CA1 HC. Insets, live IR Dodt contrast and YFP (505 nm) fluorescence. B, voltage responses upon the introduction of a 1 s long +400 pA current step from –60 mV in a PV-Rosa interneuron in (blue) control and (red) 10 μm muscarine conditions. Inset, expanded region illustrating the conversion of the afterhyperpolarization to an afterdepolarization (dotted line indicates −60 mV baseline). C, expanded region in (B) displaying mAChR-induced changes in AP firing at the offset of the +400 pA current step. D–F, as in (A–C), but for a PV-Rosa interneuron in PFC. Note that the afterhyperpolarization is not converted to an afterdepolarization by muscarine. Population data from PV-Rosa cells during wash-in of muscarine summarizing the time course of (G) change in AP frequency, (H) ADF and (I) relative change in Ihold from (blue) control to (red; at time 0) muscarine conditions. * and ** denote P < 0.05 or P < 0.01, respectively, between 3–4 min in muscarine relative to the last min in control (−1 to 0 min) for (closed symbols) HC PV cells (n = 8) in G–I (paired t test for G and H; Mann–Whitney test for I). ††P < 0.01 for (open symbols) PFC PV-Rosa cells relative to control (−1 to 0 min) in G (paired t test). Black # in H and I denotes P < 0.05 between HC PV-Rosa and PFC PV-Rosa cells (unpaired t test). ADF, afterdeflection; AP, action potential; HC, hippocampus; mAChR, muscarinic acetylcholine receptor; PFC, prefrontal cortex; PV, parvalbumin.

