
Figure 7. mAChR-induced reduction of AP amplitude.
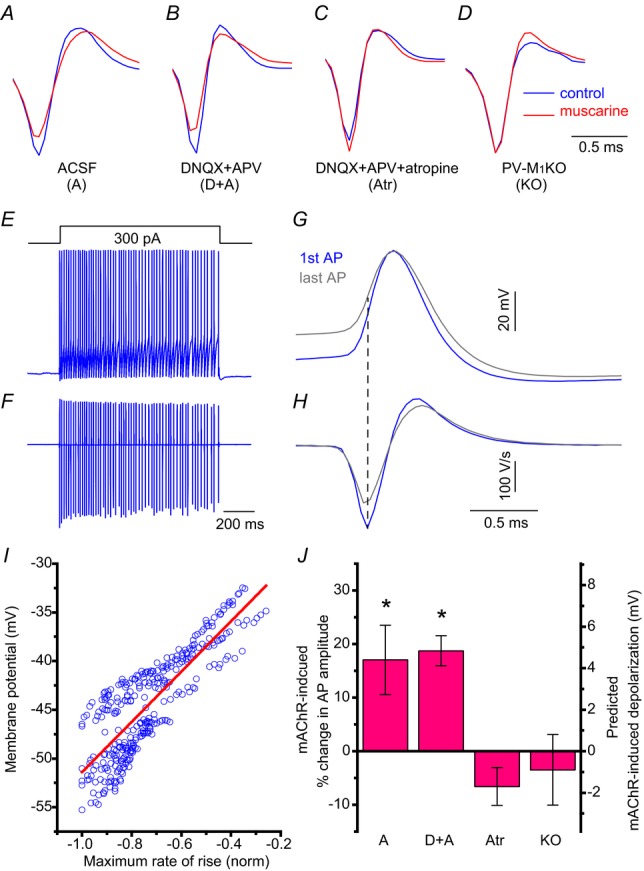
A–C, average AP waveform in loose patch mode in (blue) control and (red) muscarine from APs in Fig.6A–C, respectively corresponding to obtained under the following conditions: (A) ACSF conditions, (B) in the presence of ionotropic glutamate receptor antagonists 50 μm APV and 20 μm DNQX, or (C) in the presence of 50 μm APV, 20 μm DNQX and 5 μm atropine. A–C, from PV-Rosa mice. D, similar recordings as in (B) from a YFP+ neuron in a PV-M1KO mouse (floxed YFP AAV used to visualize PV cells). Examples of APs obtained in loose patch mode in (A) ACSF, (B) DNQX and APV, (C) DNQX, APV and atropine. D, DNQX and APV from a PV-M1KO mouse. conditions specified in Fig.6. A train of APs induced in whole cell mode after the introduction of a 1 s long 300 pA current step from −60 mV in a representative PV cell (E), time aligned with the first derivative (F). G,H, expanded first (blue) and last (grey) traces in E and F, showing how maximum rate of rise of the AP relates to the initial membrane potential (dotted line indicate the time point of maximum rate of rise in AP wave in current clamp). I, scatterplot of initial membrane potential against maximum rate of AP rise (blue open circles) with linear fit (red) (function: y = −25.58 + 25.82*x; correlation coefficient: 0.84; uncorrelated probability. P = 1e-87). J, population data showing predicted mAChR-induced depolarization from mAChR-induced percentage change in AP amplitude in the different conditions in A–D in loose patch mode (one sample t test). AP, action potential; M1KO, M1 mAChR knockout; mAChR, muscarinic acetylcholine receptor; PV, parvalbumin.