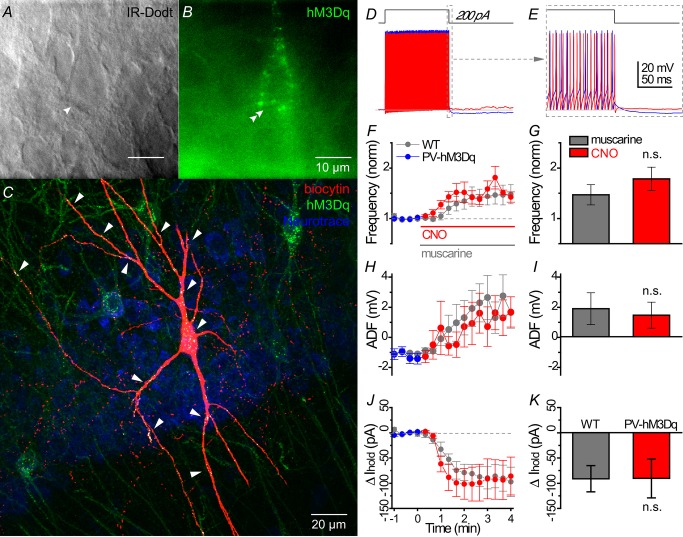
Figure 11. hM3Dq-induced changes in the cellular excitability of hippocampal CA1 PV cells.
A and B, live IR Dodt contrast and 590 nm fluorescent image of a hM3Dq-mCherry expressing PV cell in the hippocampal CA1 stratum pyramidale. The mCherry signal was pseudocoloured green to distinguish between the 633 nm biocytin signal in (C). C, morphologically identified PV basket cell as revealed by (red) biocytin labelling of the cell in (A), with white labelling indicated by white arrows showing hM3Dq-mCherry in somatodendritic regions only. D, whole cell voltage responses to the introduction of a 1 s long +200 pA current step from −60 mV in a representative PV cell under (blue) control and (red) 500 nm CNO conditions. E, expanded region in (D) displaying muscarinic acetylcholine receptor-induced changes in afterhyperpolarization during offset of the 200 pA current step. Population data from hM3Dq-expressing PV cells summarizing the time course of (F) change in action potential frequency (normalized to the average action potential frequency in a 1 min region before wash-in of muscarine), (H) ADF, (J) relative change in Ihold from (blue) control to (red; at time 0) CNO conditions. *Times where significant differences (P < 0.05) were detected between muscarine activation of PV cell WT (grey, n = 8) and CNO activation of hM3Dq-mCherry expressing PV cells in PV-CRE mice (coloured, n = 7) in (E–G) (multiple t test). G, I and K, bar graph showing no significant difference between muscarine-induced and CNO-induced effects on intrinsic excitability, ADF and Ihold (Mann–Whitney test). ADF, afterdeflection; CNO, clozapine N-oxide; PV, parvalbumin; WT, wild-type.

