
Figure 2. Behavioural parameters during prism adaptation.
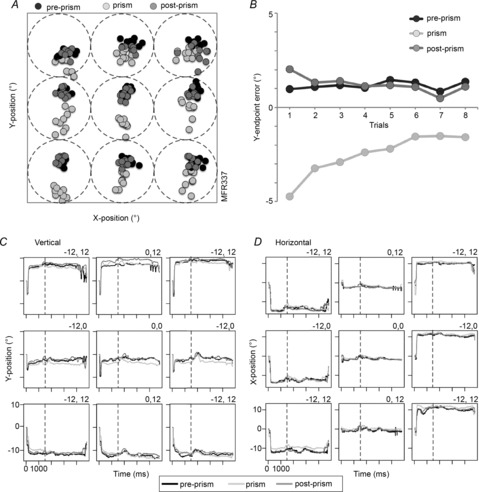
A, reach end-points for the pre-prism condition (black circles), prism condition (light grey circles) and post-prism condition (medium grey circles) plotted for all nine targets of a typical experiment (M3R337, eight trials per condition). The square illustrates the 36° × 36° touch area. Each dotted circle represents the extent of the optic flow stimulus (diameter 12°) in each of the nine target positions. B, vertical end-point errors averaged for all target positions as a function of trial progression. Average vertical (C) and horizontal (D) eye positions for pre-prism (black lines), prism (light grey lines), and post-prism (medium grey lines) conditions plotted separately for all nine targets. Eye position recordings are synchronized to stimulus onset (vertical dashed line, 1500 ms after trial onset).