
Figure 3. Comparison of mean response times for pre-prism and prism conditions.
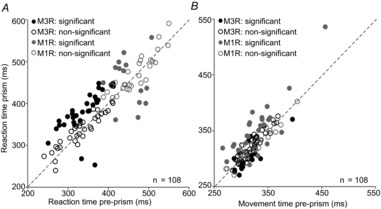
A, reaction time (time from stimulus change to lift hand). B, movement time (time from lift hand to touch). Student's t test was used for the comparison between conditions (filled circles, significant; open circles, non-significant) plotted separately for M1R (grey circles) and M3R (black circles).