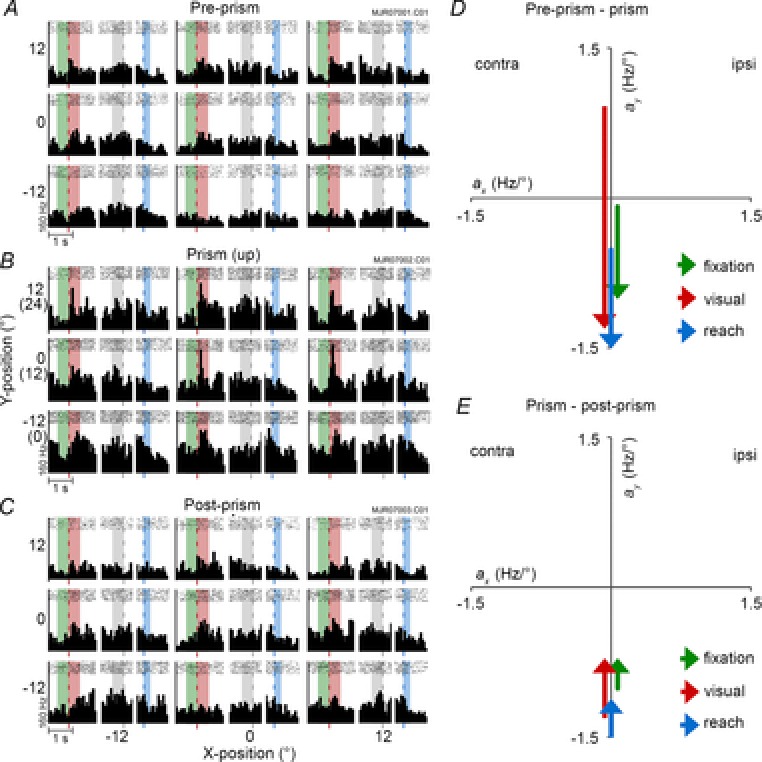
Figure 4. Responses of an area DP neuron (type C×P).

A–C, peri-stimulus time histogram during pre-prism (A), prism with 12° upward shift (B), and post-prism conditions (C). Each peri-stimulus time histogram includes fixation and visual, preparatory and reach epochs averaged over 8–10 trials (bin width 60 ms). They are arranged in a 3 × 3 grid representing each target. D and E, regression parameters showing the transitions of spatial tuning from pre-prism to prism (G) and from prism to post-prism (H) conditions plotted separately for each epoch. Fixation: Apre-prism = −0.09y + 23, Aprism = −1.01y + 52, Apost-prism = −0.71y + 28. Visual: Apre-prism = 0.92y + 39, Aprism = −1.31y + 88, Apost-prism = −0.71y + 44. Preparatory: Apre-prism = 36, Aprism = 64, Apost-prism = 40. Reach: Apre-prism = −0.52y + 27, Aprism = −1.53y + 48, Apost-prism = −1.12y + 32. contra, contralateral; ipsi, ipsilateral.
