FIGURE 2.

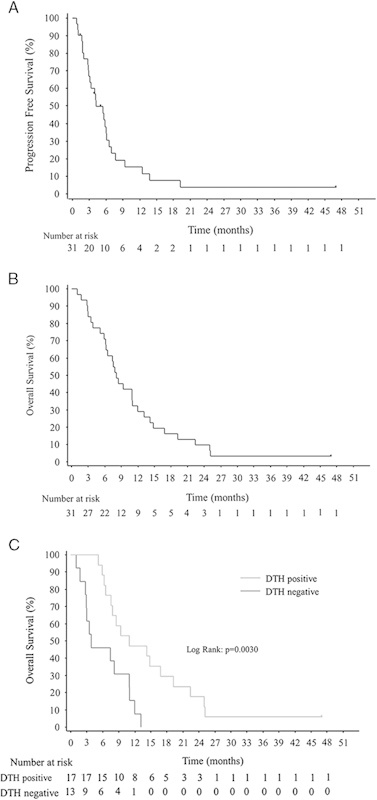
Kaplan-Meier survival curves. A, Progression-free survival (N=31). B, Overall survival (N=31). C, Overall survival in DTH-positive (gray line) or DTH-negative patients (black line). DTH indicates delayed-type hypersensitivity.

Kaplan-Meier survival curves. A, Progression-free survival (N=31). B, Overall survival (N=31). C, Overall survival in DTH-positive (gray line) or DTH-negative patients (black line). DTH indicates delayed-type hypersensitivity.