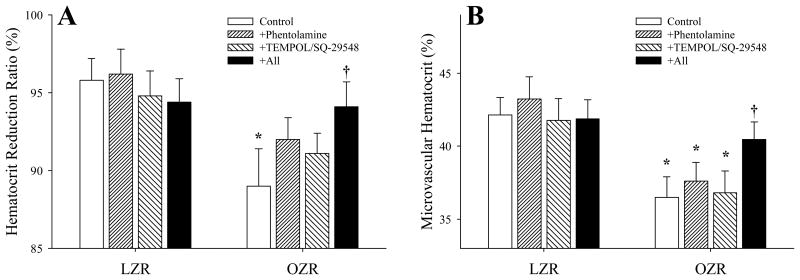
Figure 2.
Calculated hematocrit reduction ratio (%; Panel A) and aggregate microvascular hematocrit (%, Panel B) in the in situ gastrocnemius muscle of LZR and OZR under the conditions of the current study. Calculations are based on the analyses of the tracer washout curves, representative washout curves are presented in Figure 1. Data are presented as mean±SE, * p<0.05 versus LZR-Control, † p<0.05 versus OZR-Control. For LZR, n=6 for Control, n=3 for Phentolamine, n=3 for TEMPOL/SQ-29548 and n=6 for all. For OZR, n=17 for Control, n=8 for Phentolamine, n=9 for TEMPOL/SQ-29548 and n=17 for all. Please see text for details.

