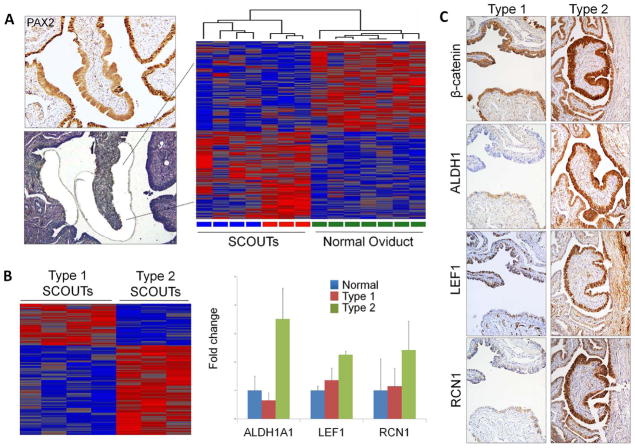
Figure 4.
(A) Laser-captured microdissected SCOUTs (left) and a Heatmap comparison of SCOUTs and normal oviduct (right). (B) Arrays generated from PAX2n SCOUTs revealed genes differentially expressed across Type 1 and Type 2 SCOUTs, including ALDH1, LEF1 and RCN1 (right). (C) Coordinated expression of the above genes distinguish Type 1 SCOUTs, which show membraneous β-catenin localization and absent ALDH1 staining plus negative or weak staining for LEF1 and RCN1 staining (right) from Type 2 SCOUTs, with nuclear and cytoplasmic β-catenin, strong ALDH1, LEF1 and RCN1 staining.

