
Fig. 1.
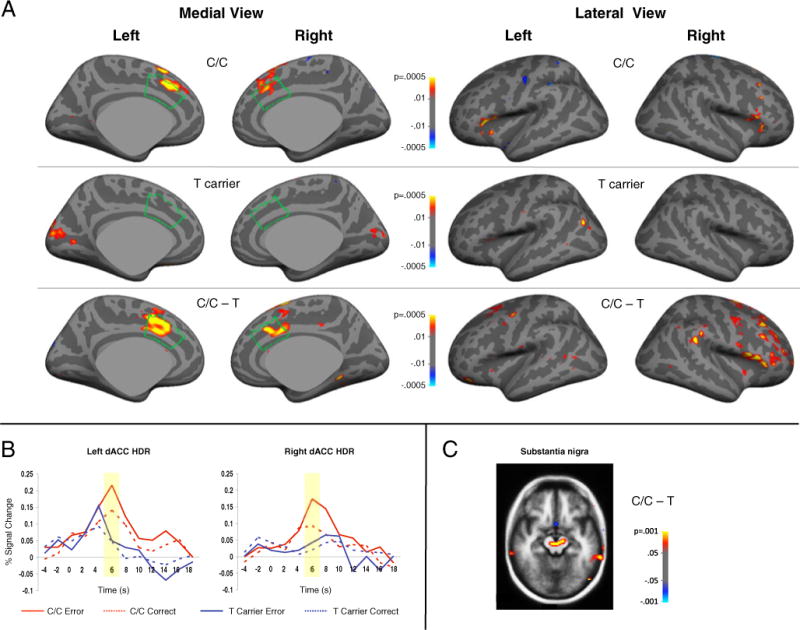
a Statistical maps of MTHFR 677C>T genotype effects on error-related activation at 6 s displayed on the inflated medial and lateral cortical surfaces. The dACC is outlined in green. b Hemodynamic responses (HDRs) of the vertices with the maximum group difference in left and right dACC separated by genotype group and condition. c Statistical map showing greater error-related activation for C/C vs. T carriers in the substantia nigra at 6 s