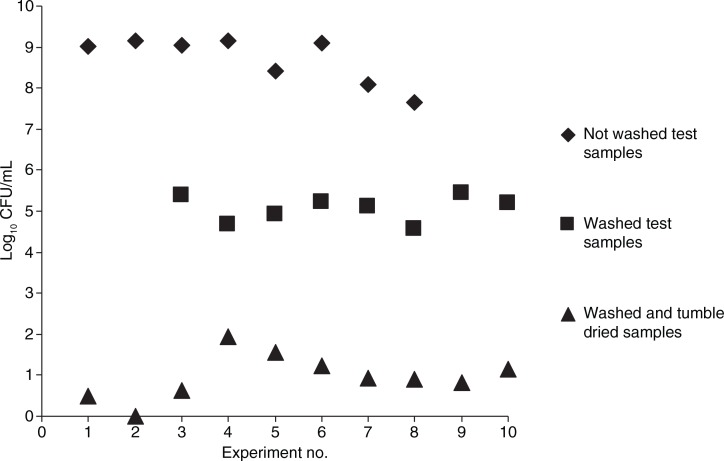
Fig. 4.
Viable counts from test samples before the laundering, after a wash cycle at 60°C, and after a full laundry process (washing at 60°C and tumble drying at a median temperature of 117.5°C). Each point in the graph represents the median number of bacterial cells from two samples before washing and five samples after washing without tumble drying and five samples after washing with tumble drying.

