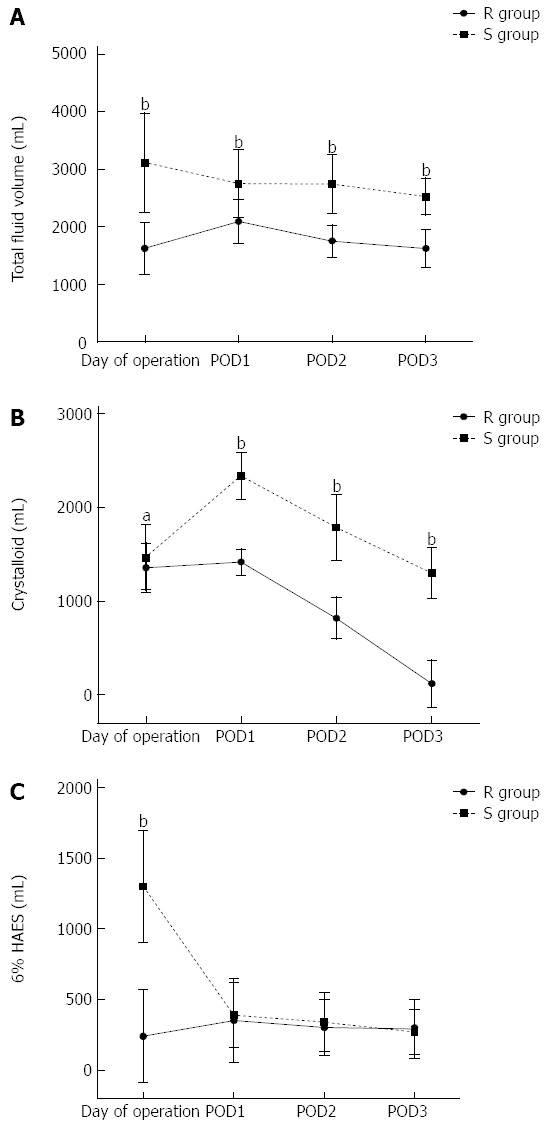
Figure 2.

Evolution of intravenous fluids received by the patients in two groups. Data are mean ± SD. POD: Postoperative day; HAES: Hydroxyethyl starch; R group: Restricted fluid therapy group; S group: Standard fluid therapy group. aP < 0.05, bP < 0.01 R group vs S group.
