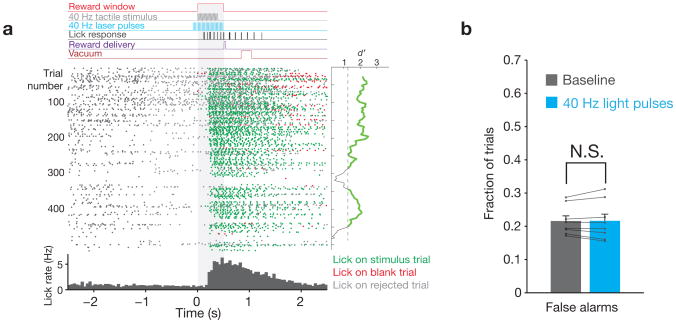
Figure 1. Task structure.
a, Top: Structure of an example trial, indicating the timing of the vibrissal stimulus relative to laser pulses, licking behavior, and the reward window. Middle: raster plot of lick times for an example session, aligned to the start of the reward window (gray shading). Each dot indicates a single lick, with color representing the trial type (hit, false alarm, or rejected). The mean d′ calculated over 50-trial periods is shown to the right of the raster plot, with the threshold of 1.25 indicated. Bottom: Histogram of lick times for this session. b, The falsealarm rate on trials with and without light presentation (N = 8 mice, 141,343 total trials, error bars indicate mean ± s.e.m.) indicate that mice did not respond to optical stimulation. Values for individual mice are superimposed in black.

