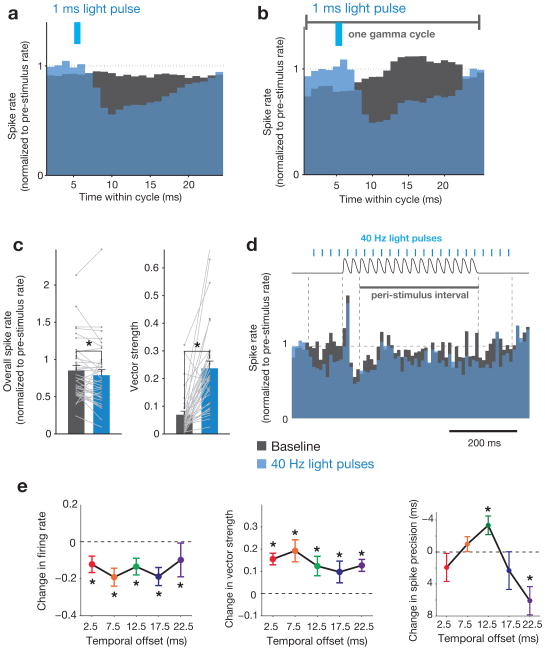
Figure 7. Interaction between optogenetically entrained gamma and the response to vibrissal deflections.
a, Mean peri-stimulus (naturalistic stimulation) spike histogram averaged over individual cycles of optogenetically entrained gamma for N = 35 regular-spiking single unitsfrom 3 miceunder two conditions: laser off (black bars) and laser on (blue bars). b, Mean spike histogram for periodic stimulation, averaged over individual cycles of gamma, time-locked to laser onset (same units as in a). c, Mean changes in firing rate and vector strength for the same units as in a. Firing rate is normalized to pre-stimulus rate. Values for individual cells are overlaid in gray. Error bars indicate mean ± s.e.m. (* = P < 0.05, Wilcoxon signed-rank test; P = 0.0420 for firing rate, P = 4.06 × 10⁻⁶ for vector strength). d, Mean peri-stimulus spike histogram for the periodic stimulation condition. Time course of the vibrissae stimulus (black trace, top) and laser pulses (blue lines, top) are superimposed. e, Left panel: Change in mean magnitude of the peak evoked response relative to the interval 100 ms prior to stimulus onset with laser stimulation, normalized to the no laser condition, for the five temporal offsets diagrammed in Fig. 6a (N = 35 single units from 3 mice; P-values are as follows: 2.5 ms offset, P = 0.0137; 7.5 ms offset, P = 0.0012; 12.5 ms offset, P = 0.0059; 17.5 ms offset, P = 0.0003; 22.5 ms offset, P = 0.0007). Center panel: Change in vector strength for the same interval (N = 35 single units from 3 mice; P-values are as follows: 2.5 ms offset, P = 7.6 × 10⁻⁶; 7.5 ms offset, P = 4.6 × 10⁻⁵; 12.5 ms offset, P = 0.00019; 17.5 ms offset, P = 0.027; 22.5 ms offset, P = 0.00021). Right panel: Mean spike precision within the first 25 ms of stimulus onset relative to the no laser condition (multi-unit activity for N = 15 electrodes from 3 mice; P-values are as follows: 2.5 ms offset, P = 0.68; 7.5 ms offset, P = 2.27; 12.5 ms offset, P = 0.014; 17.5 ms offset, P = 1.26; 22.5 ms offset, P = 0.0003).* = P< 0.05, Wilcoxon signed-rank test with Bonferroni correction; error bars indicate mean ± s.e.m.

