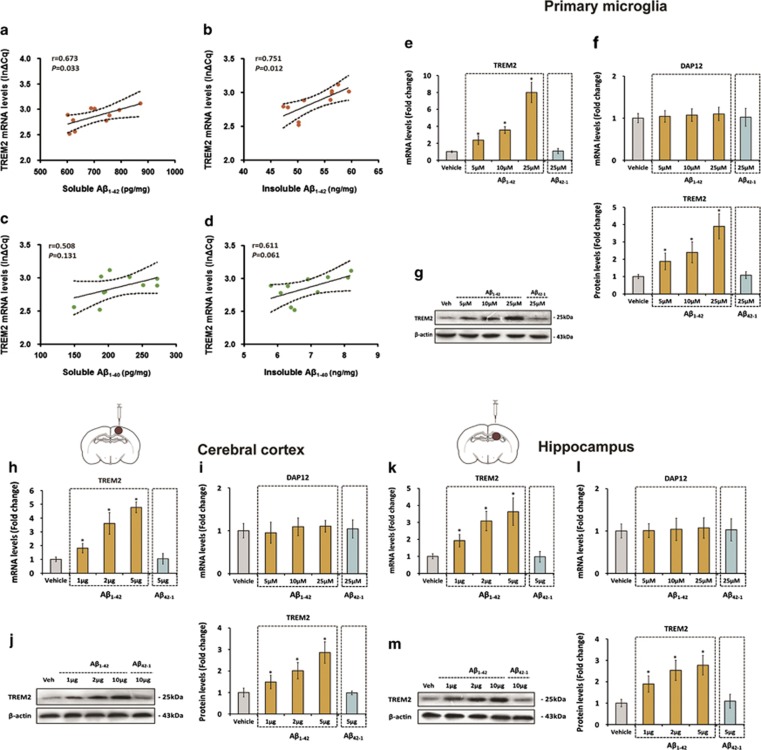
Figure 2.
Triggering receptor expressed on myeloid cells 2 (TREM2) upregulation in microglia is a direct response to the increase of amyloid-β (Aβ)1–42 levels. The levels of soluble and insoluble forms of Aβ1–42 and Aβ1–40 were detected by enzyme-linked immunoassay (ELISA), and Pearson's correlation analysis showed that TREM2 expression is positively correlated with soluble and insoluble forms of Aβ1–42 (a and b) rather than soluble and insoluble forms of Aβ1–40 (c and d). (e–g) Cultured primary microglia was incubated with vehicle, Aβ42-1, or different doses of Aβ1–42 for 24 h. Later, the TREM2 and DAP12 mRNA levels and the protein levels of TREM2 within cells were measured by quantitative reverse transcription-PCR (qRT-PCR) and western blot, respectively. (h–j) Vehicle, Aβ42-1, or different doses of Aβ1–42 was injected into the cerebral cortex of the right hemisphere of 7-month-old WT mice. At 24 h after injection, the TREM2 and DAP12 mRNA levels and the protein levels of TREM2 in the cerebral cortex of the right hemisphere were measured by qRT-PCR and western blot analysis, respectively (n=8 per group). (k–m) Vehicle, Aβ42-1, or different doses of Aβ1–42 was injected into the hippocampus of the right hemisphere of 7-month-old WT mice. Twenty-four hours later, the TREM2 and DAP12 mRNA levels and the protein levels of TREM2 in the hippocampus of the right hemisphere were measured by qRT-PCR and western blot analysis, respectively (n=8 per group). The data of qRT-PCR were normalized to the levels of glyceraldehyde 3-phosphate dehydrogenase (GAPDH) mRNA, and the data of western blot analysis were normalized to β-actin. Data were analyzed by Pearson's correlation analysis (a–d) or one-way analysis of variance (ANOVA) followed by Tukey's post hoc test (e–m). Columns represent mean±SEM. *P<0.05 vs vehicle-treated cells or animals. It should be noted that cropped gels are used in this figure, and the full-length gels are shown in Supplementary Figure S6.

