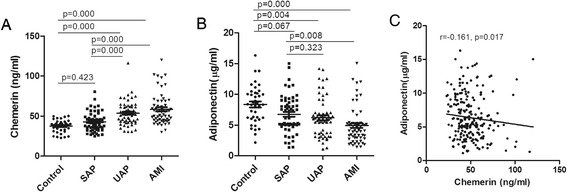
Figure 1.

The plasma adipokine concentrations in each group. A: The plasma chemerin levels in patients with AMI and UAP were significantly increased compared to those of the control and SAP groups. B: The plasma adiponectin levels in patients with AMI and UAP were significantly reduced compared to those of the control group. C: The levels of chemerin were negatively correlated with the levels of adiponectin (r = 0.161, P = 0.017).
