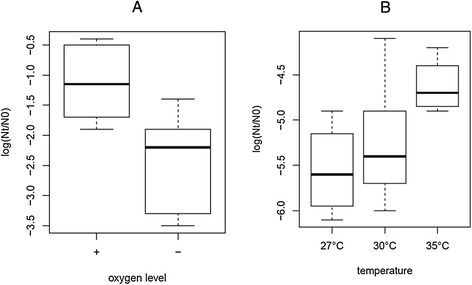
Figure 2.

Effect of oxygen level and temperature on robustness of MG1363. Boxplots of robustness phenotypes after 30 minutes of heat stress at high (+) and low (−) oxygen levels (A) and robustness phenotypes after 30 minutes of oxidative stress at various temperatures (B). Robustness is expressed as the difference of log CFU/ml after stress (Nt) and before stress (N0).
