Figure 3.

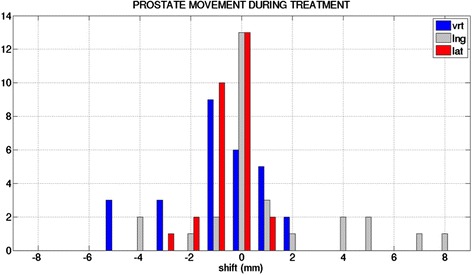
Bar diagram of intra-fraction motion in vertical (vrt), longitudinal (lng) and lateral (lat) direction during treatment (N =10). Intra-fraction motion was determined by fiducial marker difference between pre- and post- CBCT.

Bar diagram of intra-fraction motion in vertical (vrt), longitudinal (lng) and lateral (lat) direction during treatment (N =10). Intra-fraction motion was determined by fiducial marker difference between pre- and post- CBCT.