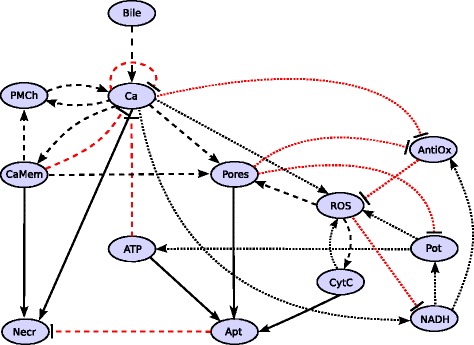
Figure 1.

Regulatory network underlying the logical functions and simulations. Variables: Bile (TLC-S), Ca (Ca2+), CaMem (auxiliary variable representing a sustained Ca2+ increase), PMCh (plasma membrane channels), NADH, Pot (electric potential across the inner mitochondrial membrane), ATP, ROS, AntiOx (antioxidants neutralizing ROS), CytC (cytochrome C), Pores (mitochondrial permeability transition pores, MPTP, and mitochondrial outer membrane pores, MOMP), Apt (apoptosis, marked by caspase activation) and Necr (necrosis, marked by trypsinogen activation). Black arrows represent an activating influence, red lines with a bar inhibition. Dotted lines represent a short time scale of the interaction, dashed lines a larger one and continuous lines the largest time scale for the output variables.
