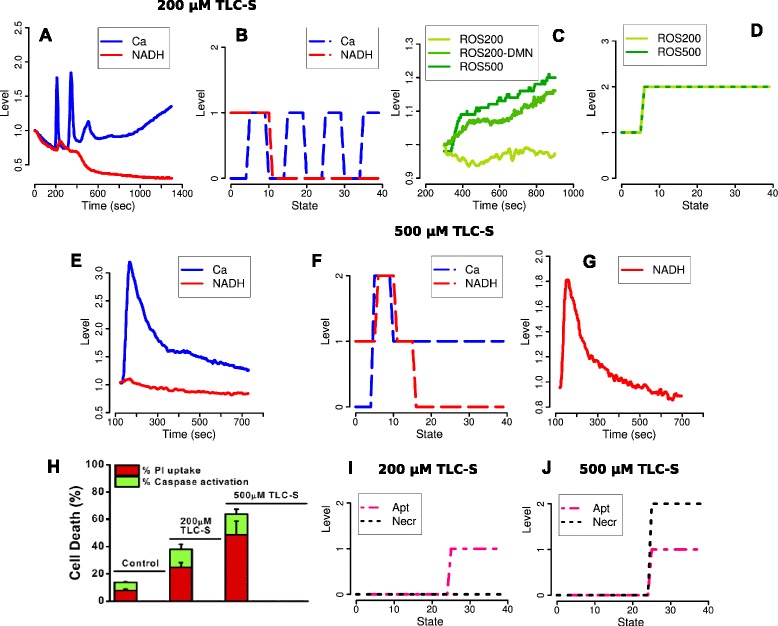
Figure 2.

Time profiles for the data and simulations during 200 μM and 500 μM TLC-S stimulation. Our simulations reproduce main features of the measurements in [2]. ( A ) 25% of the murine pancreatic acinar cells show the mixed behaviour of a sustained increase of [Ca2+]i after an oscillatory period, whereas our simulations ( B ) aim to reproduce the case of pure oscillations occurring for the majority of the cells (55%). ( E ): The strong [Ca2+]i peak after the onset of 500 μM stimulation followed by a sustained increase is mirrored by the simulations ( F ). NAD(P)H decreases over the observation time. A first NAD(P)H peak during both stimuli ( A and E ) is weak for murine cells but strong for human acinar cells after the higher stimulation ( G ). (C ): Intracellular ROS concentration increases for the higher but not the lower stimulation. Inhibition of the antioxidant NQO1 with 2,4-dimethoxy-2-methylnaphtalene (DMN) reveals that ROS production is also enhanced for 200 μM TLC-S. However, ROS are immediately scavenged by antioxidants, hence not released from the mitochondria. For both stimuli, the simulations ( D ) generate a similar ROS production defined as level 2, which is sufficient to induce CytC release and apoptosis. Compare the simulated time profiles I and J as well as H, the fraction of apoptotic cells measured by caspase activation, 30 min after the onset of the respective stimulation. Necrosis is marked by propidium iodide (PI) uptake. The x-axis of the simulations does not represent a fixed clock but the succession of logical states defined by possible changes in the values of the system variables. Pictures A, C, E and G are reproductions of the data shown in [2], H is adapted from ([2], Figure four C).
