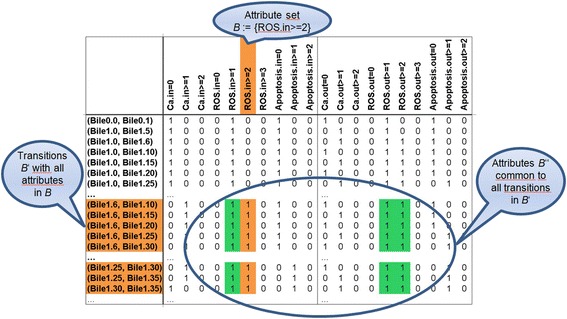
Figure 3.

Part of the transition context K sim for the simulations. The rows are transitions between states following no (Bile0.*), low (Bile1.*) or high (Bile2.*) stimulation with TLC-S. Each (input) state is connected to any of the subsequent (output) states, yielding pairs like (Bile1.0, Bile1.1), (Bile1.0, Bile1.2), …, for the time points t = 0, 1, 2,… (transitions between two identical states are not shown). The attributes in the columns give the values of the variables in the input (left) and output (right) state. A formal concept is a maximal rectangle in a context, after a permutation of rows and columns. Hence, the orange and green cells represent the concept (B′, B′′). It is generated by the attribute set B := {ROS.in ≥ 2}: First, all transitions are assembled where ROS.in ≥ 2, then – in horizontal direction – all attributes common to these transitions, including remarkably ROS.out ≥ 2. This concept construction expresses that the ROS concentration does not decrease as soon as level 2 is reached. The concept also describes a transition set in the data.
