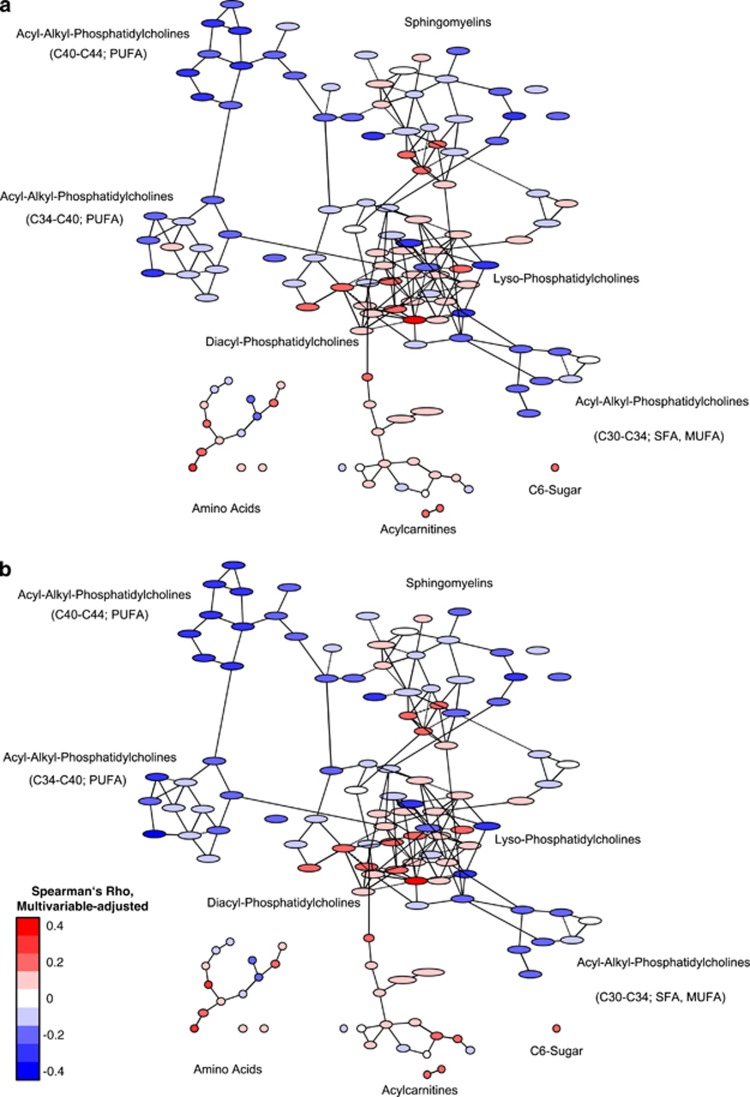
Figure 2.
Association between BMI (a) and waist circumference (b) and the serum metabolite network of the EPIC-Potsdam subcohort. Presented are partial correlation coefficients adjusted for age, sex, education, alcohol consumption, smoking and physical activity, adapted from Bachlechner et al.12 Red color implies positive association and blue color inverse association between exposure and metabolite. Intensity of the color reflects the strength of association.

