Figure 3.
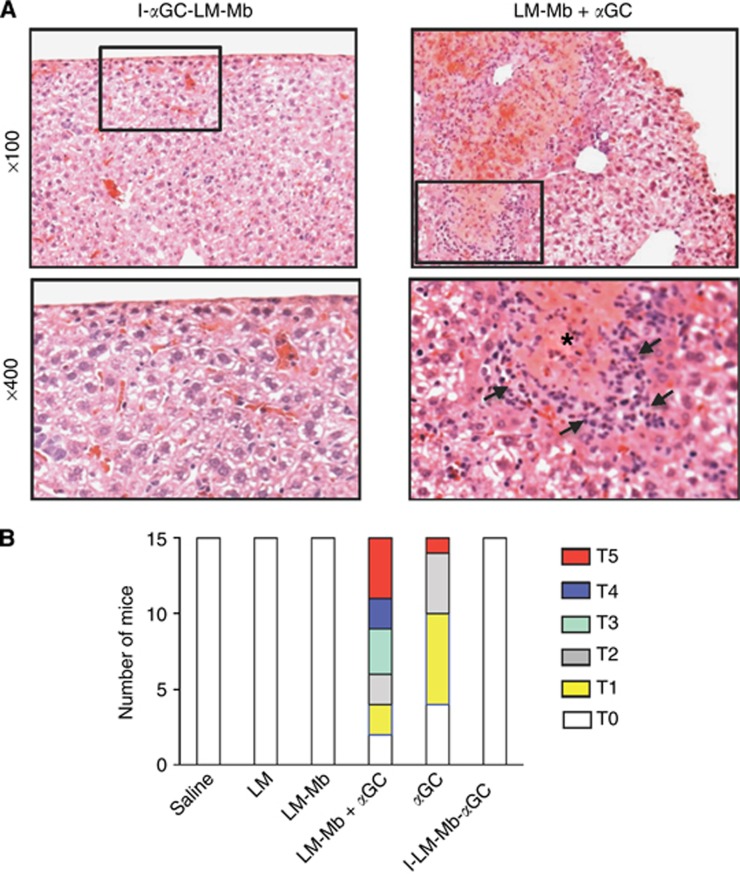
Hepatotoxicity of αGC administered as a separate agent but not when incorporated into LM-Mb. Representative micrographs of H&E stained sections from the livers of mice 4T1 tumour-bearing mice that received I-αGC-LM-Mb (left) or LM-Mb+αGC (right) as described in Figure 1, and killed on day 18 (A). Low power views (top) show normal appearance of liver tissue typical for I-αGC-LM-Mb-treated mice, and foci of necrosis and inflammatory cells that were common in mice receiving LM-Mb+αGC. Higher magnification views of the boxed areas are shown in the lower panels, with an area of necrosis marked by the asterisk and arrows indicating leukocyte infiltrates for the LM-Mb+αGC sample. Summary of semiquantitative grading of toxicity based on gross liver pathology (B). BALB/c mice were challenged with 4T1 tumour cells and immunised therapeutically i.p. with saline or the single or combination regimens as described in Figure 1. Toxicity was graded in each mouse by visual inspection of livers at necropsy using a scale from T0 to T5 as described in Materials and Methods. This experiment was repeated three times with N=5 mice per group and the results of all experiments are combined in the graph shown.

