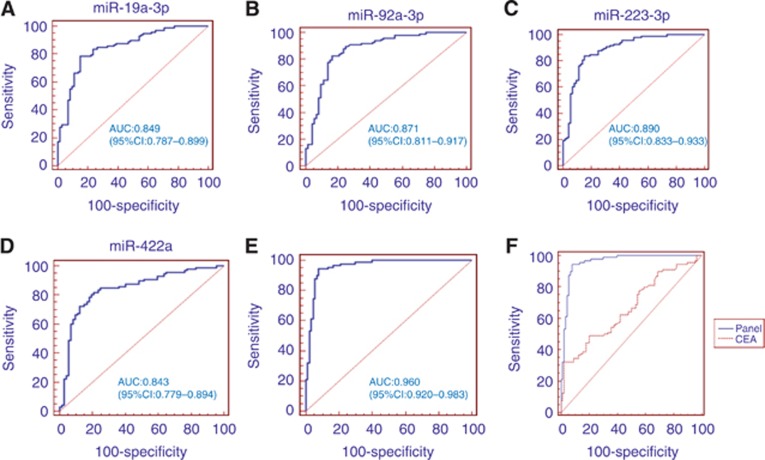
Figure 5.
Receiver operating characteristic (ROC) curves for the ability of the four individual miRNAs (A–D) and the 4-miRNA panel (E) to differentiate the CAC patients from the control group in the training phase. Comparison of ROC curves for the ability of the 4-miRNA panel and carcinoembryonic antigen (CEA) (F) to differentiate the CAC patients from the control group in the validation phase.

